Read about Chris’s project updates, nine months into his service term:
With a little over two months to go, there is still a lot of work to get done and loose ends to tie up! Currently I am working consistently on three major projects: Completing the FY15 inventory report for the City of Missoula, completing the baseline community inventory for the Missoula community, and working to conduct a baseline study of Missoula’s waste stream as the foundation for the creation of Missoula’s Zero Waste Plan.
City Inventory:
First up: the ever-lingering FY15 inventory is near completion. In that we have all the necessary data collected and calculated and have met with department heads to present and discuss findings as to what the findings are and why they occurred. Now the only thing that remains is finalizing the report and presenting the findings to City Council. And the findings are good! In the City’s Climate Action Plan, the goal for interim year 2015 is for us to see a 10% reduction in CO2e emissions for municipal operations…and we are at 11%!
However, that number is arguably misleading, depending on how you view it. The FY15 City inventory is an inventory measuring how much energy (electricity and gas) all municipal operations for the City of Missoula use. To do this, we gather all the City’s energy usage, and then we input the energy data into a GHG calculator called Clearpath to ultimately calculate the City’s carbon CO2e output to understand what our carbon footprint is. To do so, Clearpath multiplies the energy usage by inputted factor sets, which are set variables used to represent and develop the emission outputs. For example, the factor set for grid electricity includes CO2, CH4, and N20, because they are the three variables/gases emitted through the generation of grid electricity. Furthermore, the cleanliness of the energy generation impacts the amount of CO2 emitted per energy. So, a power plant that utilizes cleaner power and more renewable energy will have a cleaner energy mix and thus less CO2, CH4, and N20 will be emitted. To format this into our Clearpath calculations, instead of having to know exactly what Missoula’s mix i.e. Northwestern Energy’s mix is, we use EPA issued eGRID calculations, which is what the EPA provides to tell you what one’s energy mix is based on regional averages. We are in the NWPP (Northwest Power Pool) because we are categorized in the Northwest region, along with Washington, Oregon, Northern California, and much of the Rockies. Having established all that, now back to how it relates to the inventory.
Despite seeing a 11% reduction in our City’s carbon emissions output from the 2008 baseline inventory, we saw a 14% energy consumption increase. Now how is this possible? Firstly, although our energy usage increased, our natural gas consumption decreased by 17% – and natural gas is much dirtier and generates more MTCO2e relative to electricity. Secondly, it largely comes down to the factor sets. The eGRID 2007 used for the 2008 baseline inventory, the rates issued in 2007 compared to eGRID 2012, had much higher rates of greenhouse gases emitted from power generation. In other words, power generated for the northwest region then was dirtier than what is generated now, on average. Comparing the two, the percent decrease of CO2 lbs per MWh energy usage dropped 26% from 902.24 to 665.76 from eGRID 2007 to 2012. CH4 dropped 34% and N20 17%. This is because through the Northwest’s investments in and implementations of renewable energy and cleaner power plants for power generation, the NWPP regional average is now significantly cleaner than it was 5+ years ago. I said this is misleading for two reasons. Firstly, we decreased our footprint despite increasing energy consumption, and secondly, 11% reduction assumes that the quality of the mix used to generate Missoula’s energy is the same as the eGRID averages which it is not. To qualify the first point, despite the growth, this shows that the quality of one’s energy generation is arguably more important than energy reduction, though both are priorities. All in all, however, the message is a positive one. That clean energy is arguably the most significant factor for reducing CO2e. Moving forward, this realization can and should be used to justify investments in renewable energy, policies pushing for cleaner energy generation such as the EPA Clean Power Plan etc. etc. The imperative at hand is that we must do what we can, to investment in what we can, as fast as we can, to cleanse the energy we generate so that we can con continue to decrease and ultimately neutralize our carbon footprint in our city, state, country and world.
Community Inventory:
Now on to the community inventory, and we are still hacking away. The community inventory is frustrating because the progress solely depends on the immediacy of others, and how quickly certain agencies are able to relay their respective data. Unfortunately, some/most take significant time. I input bulk, aggregate data all at once. So the responsibility is on others, not me unfortunately to gather and collect this information together, which takes time. Not to mention time required on top of their other respective tasks. For example, for aviation data—to calculate community carbon emissions from all aviation travel—we met with the director of the Missoula International Airport. After meeting with him, one meeting turned into one meeting plus multiple email chain exchanges, a phone meeting or two, all of which took over a month. Then, once all said and done, we were able to input the aggregate data of all aviation travel in Missoula into the software, which took a total of 30 seconds. So that’s frustratingly good that we were able to check that one off the list but this example sheds light on how long and tedious the community inventory can take to gather data, while inputting is quick and easy.
We are nearing completion but the two sections that remain are NW energy aggregate data and on-road transportation data, which happen to be the biggest sections of the inventory. Therefore we still cannot accurately gauge the size of Missoula’s community-wide footprint but we expect it to be of decent size. With only two months left, it will be close as to whether I am able to complete the report and we can gather the remaining missing pieces. I am hopeful that we will be able to get the data soon, but the process to gather information from Northwestern Energy in the past has been a timely process because the nature of these things takes time. I am hopeful that the loose ends end will get tied before the end of my service, as the culmination of the baseline community is important for addressing energy conservation and carbon reduction efforts needed for the Missoula community moving forward.
Zero Waste:
Zero Waste! The Zero Waste Plan is probably my favorite project, as it is exciting to see Missoula taking steps towards waste reduction. I also enjoy it because the topic is fascinating and is full of lots of cool things to learn, cool webinars to watch on how the hippest cities are striving to improve waste diversion through policies, programs, and innovative reduction techniques. To give a background on ZW, the City adopted the ZW Resolution in February, declaring that the City of Missoula will lead the charge to divert 90% of Missoula’s current waste stream by 90% by 2050. In order to do so, firstly, we must conduct a waste baseline study to figure out the amount of waste disposed, where it comes from, and what it’s made of. We are working with Republic Services to conduct the study and it is exciting to see the progress made in partnership with a crucial community ally in waste reduction moving forward. Once we know our waste stream, the next step is to create a zero waste plan, which is a plan comprised of practices, policies, and programs outlining ways to reduce, reuse, and recycle to divert as much as possible from the landfill. It’s great to see and experience firsthand the strides being taken and strides we will continue to take to not only reduce considerable waste stream carbon emissions, but to walk down the road towards more sustainable consumption behaviors and towards a more sustainable local economy that will create many local and innovative jobs for Missoulian residents. There are positives to be gained for the community, economy, and environment everywhere.
With only a little over two months to go, I am excited to continue working to complete and progress the projects I am working on before my time is reluctantly over here at the City of Missoula’s Energy Conservation department.
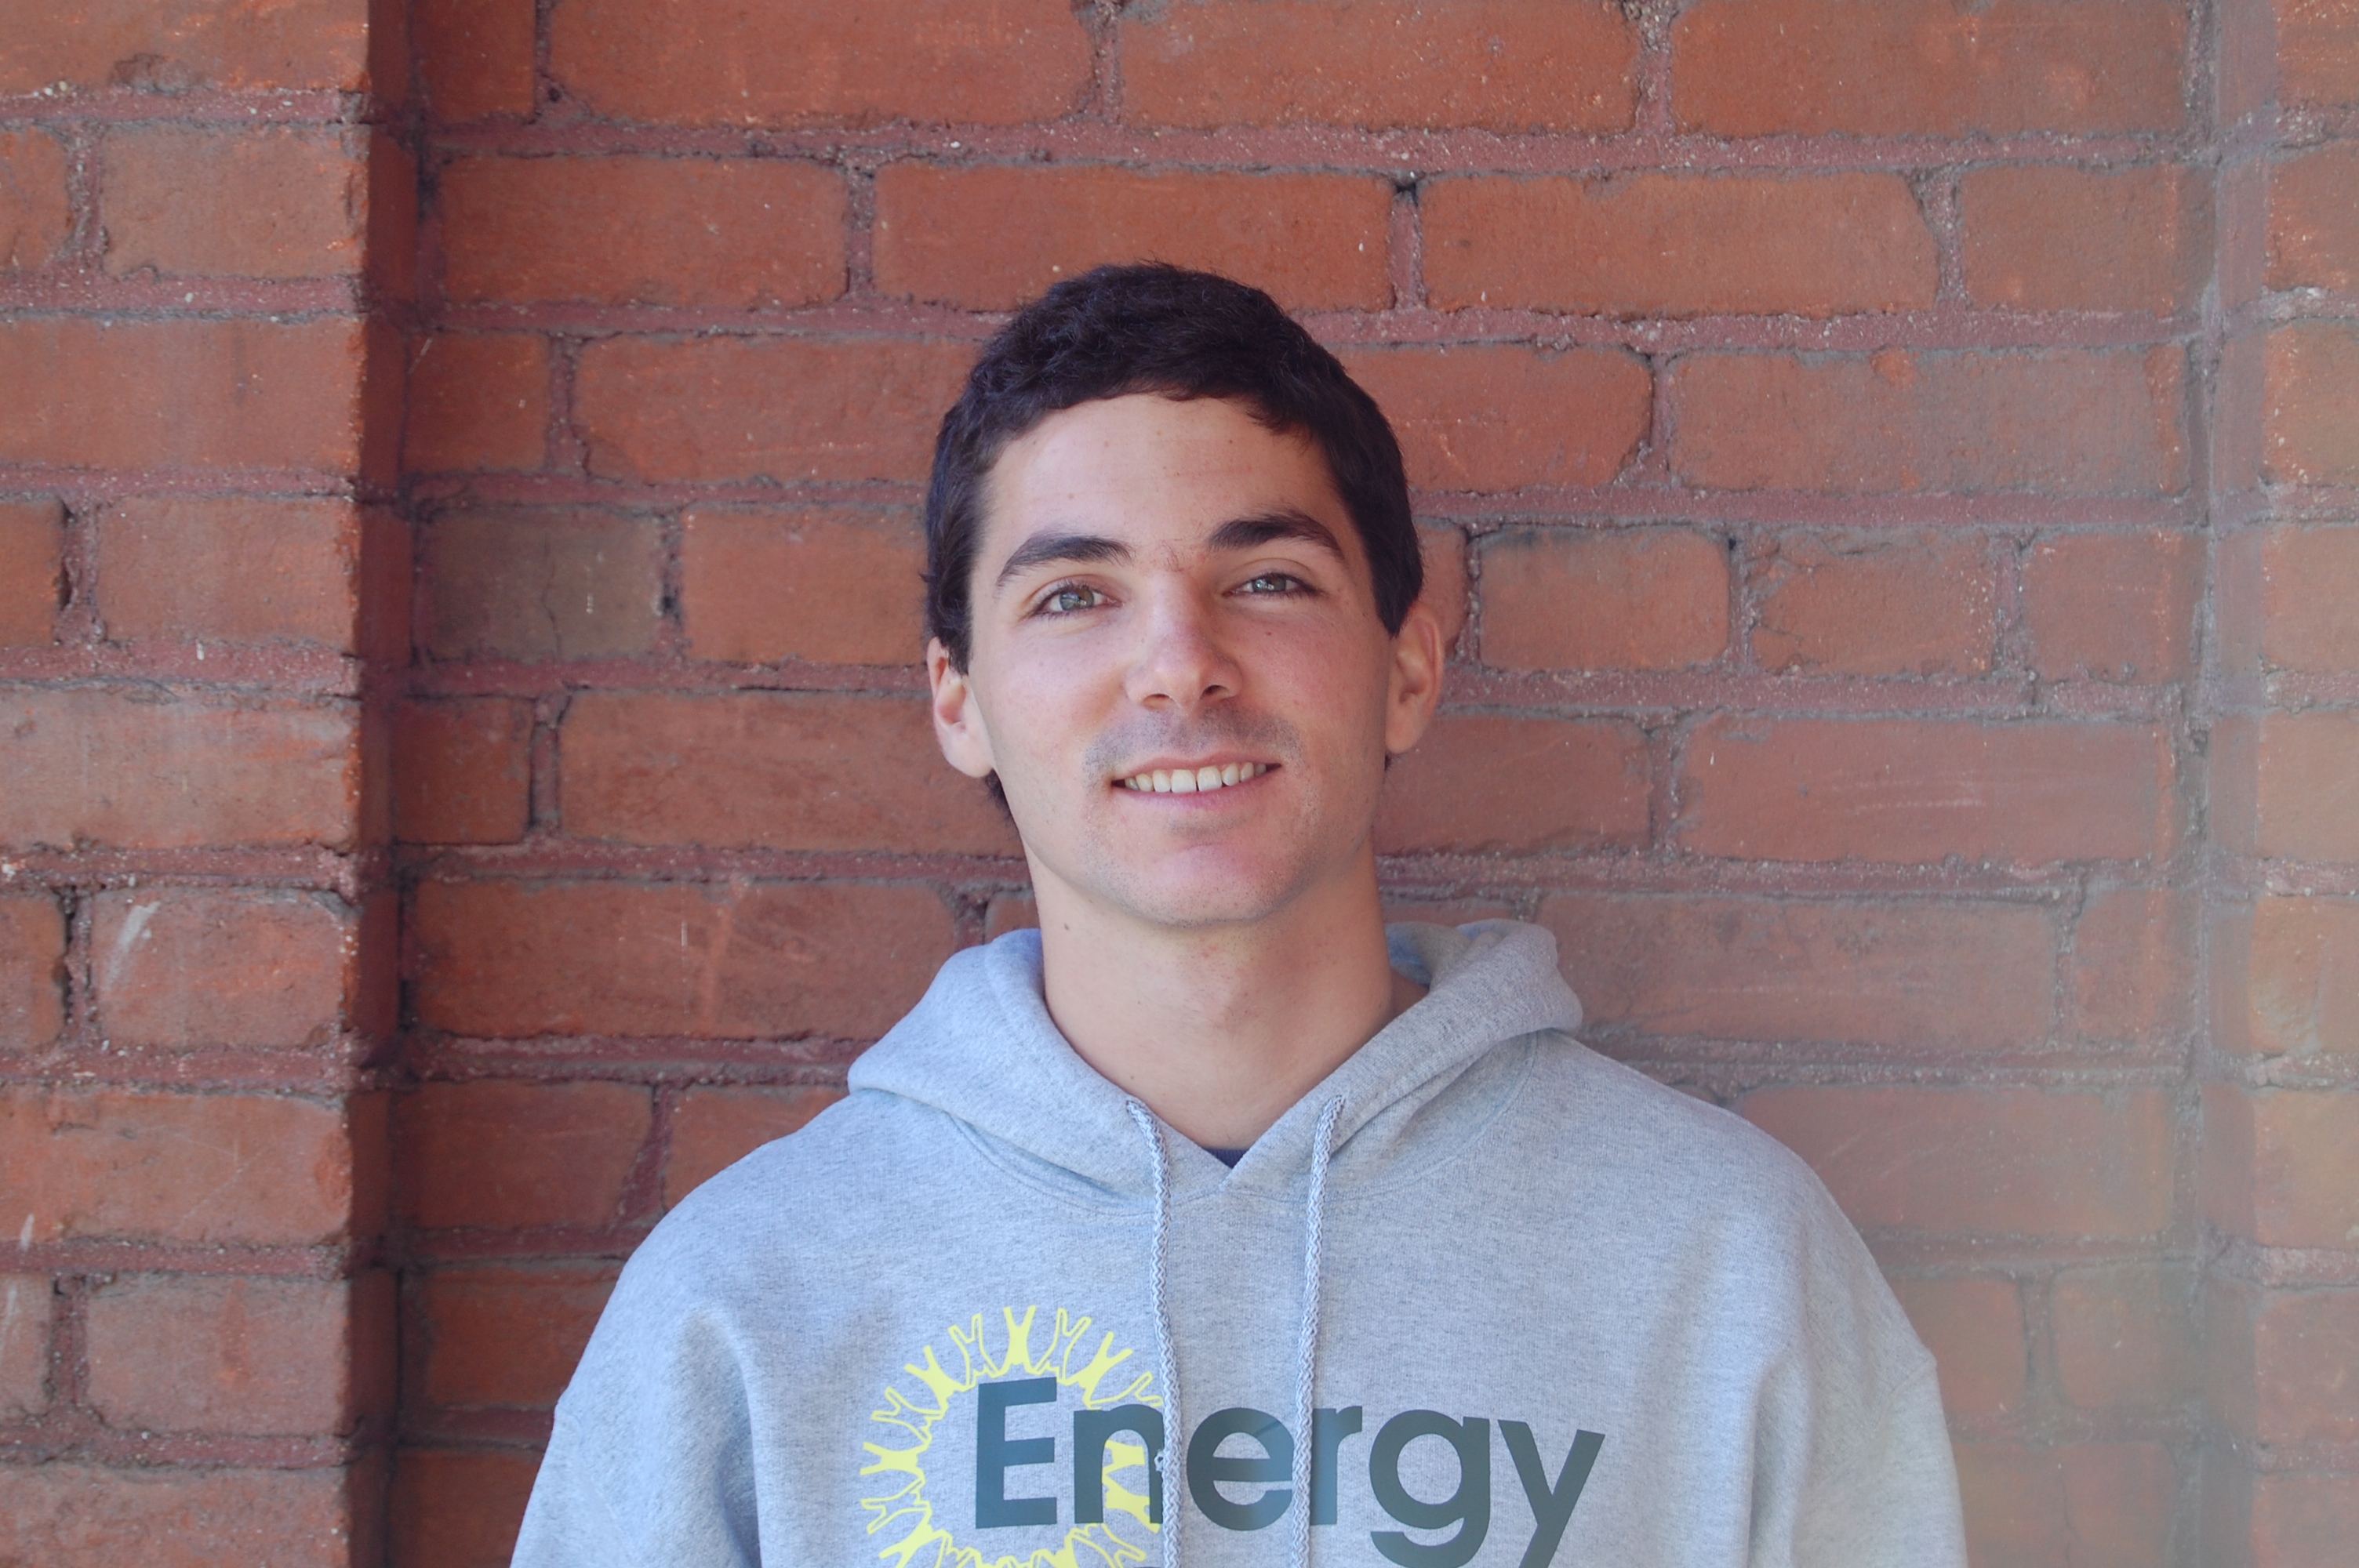 Christopher Essman graduated from Elon University with a B.A. in Political Science. He also minored in Philosophy, Leadership Studies, and Poverty and Social Justice. His professional experience includes a year-long internship at Elon’s Truitt Center for Religious and Spiritual Life, a summer internship at Caritas of Austin, and several years as COO at his local startup landscaping business. Chris serves as the Energy Conservation and Sustainability Educator for the City of Missoula. His project work includes municipal and community greenhouse gas accounting and reporting, collaboration with Climate Smart Missoula, energy and utility tracking, benchmarking and reporting, as well as researching and presenting policy considerations.